Some lab balances, usually analytical or semi-micro models, feature a statistics function. But what does that mean? How can you use that data? Is it worth buying a balance with that feature? In this post, we’ll explain statistics as they relate to lab balances.
What are Statistics?
For our purpose, statistics are defined as pieces of data from a numerical data set.
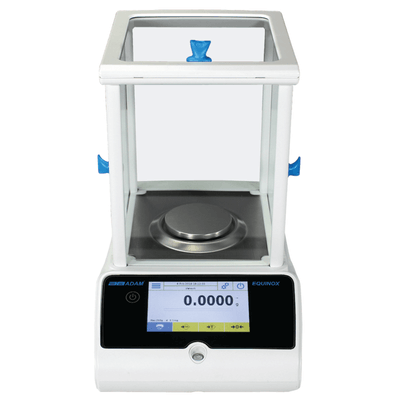
Some lab balances, like our Equinox analytical and semi-micro range, allow users to collect statistics in various modes. Users can collect statistics during weighing, counting or percentage weighing modes.

Statistics collected by lab balances:
Tolerances: tolerances can be set by users to decide which sets of data should be kept in the statistics. For example, if you know your measurements should be between 0.056 and 0.732 grams, you can exclude anything under or above these limits. That allows you to get rid of outliers that could mess up your data (the coefficient of standard deviation, for example), or to pick and choose specific sets to analyze.
Minimum and Maximum Values: The highest and lowest values recorded from measurements.
Difference: The difference between the max and min values.
Sum: The sum of the max and min values.
Average: The average of all the measurements recorded, calculated by dividing the sum of all measurements by the number of measurements.
Standard deviation: The measure that indicates the deviation, or changes, of the group of measurements. It indicates how different your measurements are from one another.
Coefficient of standard deviation: A percentage that indicates the relative variability of your data. It’s the ratio of the standard deviation to the average. The balance includes this because it can allow users to compare results different data sets even if they’re not evaluated in the same way.
For a single measurement, standard deviation is useful, but the coefficient is a better measure of variation for multiple data sets and can take context into account.
Balances also record how many samples you weighed (you can collect statistics for up to 500 consecutive weights on the Equinox), references (if there are any) and the parameters of the mode during which statistics are collected.
The Equinox also allows users to store, recall and create databases with custom statistics methods. Users can store descriptions, nominal weights and tolerances. The balance will automatically check the method to ensure it is correct when users save it. You can output the data via RS-232 or USB interfaces to printers, directly to computers or on a flash drive as needed.

What’s the point?
You can collect statistics. Big deal. But how do you use them? There are many different uses for this type of data; statistics can be kept for traceability and evaluation of the instrument for studies and experiments. They can be an insight into the balance’s suitability for certain tasks. Statistics can be especially useful for quality control labs, where every part of the process is scrutinized.
Scientists can take the raw data and analyze it to reveal patterns, confirm or reject hypothesis, find correlations and more. You can use statistics to find standard deviation and other information that will help you decide whether your data is usable for a study. Statistics can reveal errors, or whether the standard deviation of your results is acceptable, and setting tolerances ensure you have a clean data set. From medicine to quality testing, statistics are used to learn more about the materials tested and how they can be used.
Adam Equipment designs lab balances for professionals, combining remarkable precision and superior accuracy into a balance that’s intuitive and easy to use. Learn more about our new Equinox lab balance here: www.adamequipment.com/equinox-analytical-balances.

